This blog post is motivated by three seemingly unrelated events -- a mail by an IIT Kanpur batchmate pointing out the availability of JEE 2009 marks of each of its 384,977 test takers, down to name, father's name, gender, PIN, category, and marks in different subjects (yes, this would be a major violation of privacy in US or in any of the European countries, but apparently not in India); a brief encounter with R-Project, a software package to do statistical analysis, in course of doing some day job related number crunching; and a simmering interest in comparing relative performance in tests. The giant list of marks (warning: it is a 67 MB PDF) of individual details turned out to be the starting point for questions like: How does the frequency distribution of marks look like? Is it bell-shaped? Is it same for boys and girls? Is their any perceptible difference in marks for different subjects? Is there any correlation between marks of different subjects -- say, Maths and Physics, or Maths and Chemistry, or Chemistry and Maths? Is the correlation, if any, different for boys and girl? for students scoring high or low total marks?
Of course, I have many more questions, some relating to factors not reported in the list such as influence of parental income and education, correlation with performance in +2 exam, impact of attendance in coaching institutes etc. and some relating to factors reported in the list but not of sufficient interest to me, such as PIN and reservation category.
While playing with R, I discovered that I could load the MS Access file of marks directly into R and do simple analysis by directly issuing R commands against the loaded data. For example, following is a brief session with R console, string "jee2009" being an ODBC DSN, configured in Windows Control Panel ODBC Setup icon, pointing to the downloaded MS Access file.
// load ODBC plugin
> library(RODBC)
// connect to MS-Access DB
> ch <- odbcConnect('jee2009')
// show table names
> sqlTables(ch)
... list of tables ... (snip)
// show columns of a table
> sqlColumns(ch, 'All Marks')
... list of columns ... (snip)
// show number of rows
> sqlQuery(ch, "SELECT count(1) from `All Marks`")
  Expr1000
1   384977
// show number of rows for Boys
> sqlQuery(ch, "SELECT count(1) from `All Marks` where GENDER='M'")
  Expr1000
1   286942
// show number of rows for Girls
> sqlQuery(ch, "SELECT count(1) from `All Marks` where GENDER='F'")
  Expr1000
1    98028
// show average of physics, chemistry, maths and total
> sqlQuery(ch, "SELECT AVG(phys), AVG(chem), AVG(math), AVG(mark)
from `All Marks`")
  Expr1000 Expr1001 Expr1002 Expr1003
1  7.80696 10.43663  10.1155 28.35909
// quit
> q()
So, there were a total of 384,977 test takers, consisting of 286,942 boys (74.54%) and 98,028 girls (25.46%).
The following table shows some more stats on aggregate and individual marks for Boys and Girls in each of the three subjects:
| Metric | Boys | Girls | ||||||
|---|---|---|---|---|---|---|---|---|
| Phys | Chem | Maths | Total | Phys | Chem | Maths | Total | |
| Minimum | -35.00 | -35.0 | -35.00 | -86.00 | -35.00 | -35.00 | -35.00 | -77.00 |
| Maximum | 156.00 | 132.00 | 156.00 | 424.00 | 144.00 | 124.00 | 146.00 | 362.00 |
| Average | 8.79 | 11.10 | 10.90 | 30.79 | 4.92 | 8.49 | 7.81 | 21.24 |
| Median | 4.00 | 7.00 | 7.00 | 17.00 | 3.00 | 5.00 | 5.00 | 13.00 |
| Std. Dev | 19.61 | 19.98 | 18.86 | 51.80 | 13.64 | 17.13 | 15.37 | 39.26 |
Girls seem to be seem to be showing poor performance than boys in almost every metric. I wasn't quite expecting comparable performance but was surprised nonetheless! Could this just be a manifestation of the societal stereotype that girls are not supposed to be good at Engg. oriented subjects like maths, physics and chemistry. Or is there some other force at work?
Share of Marks in Different Subjects
Let us look at the average share of marks in Physics, Chemistry and Maths for all students.
> sqlQuery(ch, "SELECT sum(phys)/sum(mark), sum(chem)/sum(mark),
sum(math)/sum(mark) FROM `All Marks`")
   Expr1000  Expr1001  Expr1002
1 0.2752895 0.3680171 0.3566934
Physics marks account for 27.53%, Chemistry for 36.80% and Maths 35.67%. Restricting entries to Boys only gives the corresponding shares as 28.56%, 36.04% and 35.04%. The corresponding figures for girls are 23.17%, 40.02% and 36.81%, implying girls did better in Chemistry than in Physics and Maths.
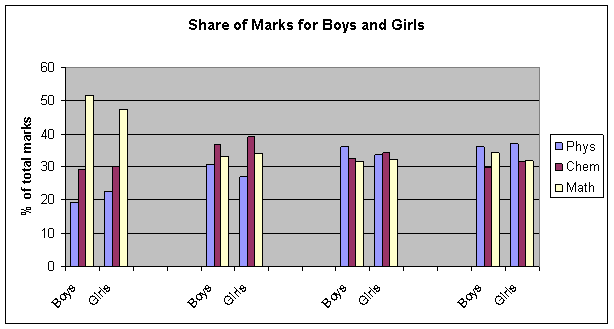
However, restricting the population to those with total marks within certain range, say 0-10 (low performing), 100-110 (better than average), 200-210 (significantly better than average) and 300-310 (high performing) doesn't give any clear trend, as evident from the accompanying chart.

Surprisingly, both boys and girls did better in Maths in the low performing range but not in other ranges. Also, relative performance in different subjects doesn't seem to depend on gender at all.
Correlation Between Marks of Different Subjects
If a person does well in Math then is he or she also likely to do well in Chemistry? in Physics?
To answer this, I looked at correlation coefficient between marks of different subject for the groups of JEE aspirants defined by their total marks, as in the previous section.
> marks <- sqlQuery(ch, "SELECT phys, chem FROM `All Marks` where
GENDER='M' AND mark >= 300 AND mark <=310")
> cor(marks)
           phys       chem
phys  1.0000000 -0.2912179
chem -0.2912179  1.0000000
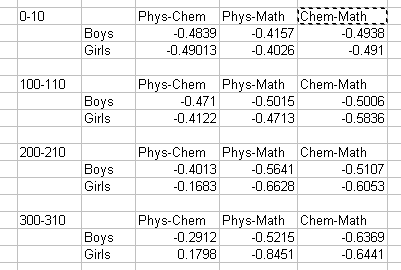
And here are all the different correlation coefficients:

To my utter amazement, I see no correlation. In fact, I see negative correlation in most cases. I was expecting positive correlation for most subject pairs, especially among high performing students. But no, there is no correlation. How is this possible?
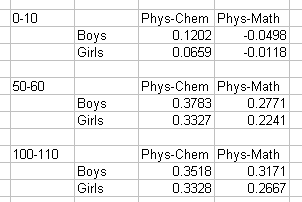
Then I tried grouping of population based on marks in a particular subject. The following table shows correlation coefficients for groups that got 0-10, 50-60 and 100-110 in Maths.

This shows most correlations as positive. So those who do well in Maths are more likely to show similar performance in other subjects as well. In fact this is not limited to Maths only. I calculated correlations based on Physics and Chemistry and found similar results.
The only explanation of these observations I can think of is that high total marks is not a good predictor of consistent performance in all subjects, whereas marks in a particular subject is. If true, this is a very significant, for JEE 2009 based its ranking on total marks and not on marks in a specific subject, even though higher marks in a particular subject is a better predictor of consistent performance! Of course, it is hard to decide which subject to pick for ranking.