XML Processing Measurements using XPB4J
Last Updated: May 30, 2002
Disclaimer: All data presented in this document are developed in my own time using my personal
equipment and communications capabilities. Similarly, opinions expressed are my own and do not
represent, in any way, those of my employer.
Note ( added on July 10 ): It was pointed out by JDOM-Interest group that the XStat processing
code using JDOM API was using an indexed traversal whereas the JDOM Javadoc recommends an interator
based traversal. I made the suggested change and found that the non-linear performance degradation
for large XML files does go away with this change. However, there is very little impact on observed
performance for small files ( < 100 KB ). You can find the details in the
defect report.
You can also look at
the modified code.
I will revise this document and update the reported figures when I rerun all the tests ( and some more ).
In the meanwhile, if you want to run the modified XPB4J then get it from CVS as described in the
User Guide.
This writeup documents a set of measurements taken by me using
XPB4J-0.90 and conclusions
based on these measurements. The purpose of these measurements is to gain insight into answers to
some of the frequently asked questions related to XML processing in Java.
If you have been using Java
to process XML documents and similar questions, you may find some answers here.
These measurements are for a specific processing, called XStat Processing, on one or more
XML data files. Measurement figures and conclusions are dependent on these and must not be assumed
to have universal validity. XStat Processing of an XML document consists of scanning the file and
collecting certain statistical information about the structure of the XML file.
Please refer to the XPB4J User Guide for more information on
XStat Processing.
These measurements were taken in the month of May 2002 on my Windows 2000 machine and have used
a wide variety of Java XML Parsers and Processors.
Though I have tried to be objective and unbiased in my reporting, it is always possible that
I would have made some silly assumption or made stupid mistakes. If you come across any
flaw, either in this document or the measurement program or
the way the measurements are taken, please
let me know.
The measurements were taken on a AMD Athlon ( 900MHz ) machine with 512MB of SDRAM running Windows
2000.
Software environment consisted of:
Certain other versions of these software were also used for comparison as reported under
Conclusions from Mesurements.
Measurements were taken with default configuration parameters
and placing the appropriate jar files in lib directory and input data files in data
directory. Default configuration parameter values are: xpb.loopcount=100, xpb.runcount=4,
xpb.verbose=off, xpb.gc=off.
Execution of the measurement program was started by invoking the command
"ant run".
Refer to XPB4J User Guide for
more information on default parameters and ways to start the measurement program.
The measurement program executes the following loop for measurements:
  // Code for illustration only. Won't compile.
  for (int r = 0; r < 4; r++)	// 4 runs
    {
    Runtime.gc();	// Hope that this will force garbage collection.
    long startMem = Runtime.totalMemory() - Runtime.freeMemory();
    long startTime = System.currentTimeMillis();
    for (int l = 0; l < 100; l++)	// 100 loops
      {
      for (file f in input files ) // Do the processing.
        process f;
      }
    long endTime = System.currentTimeMillis();
    long endMem = Runtime.totalMemory() - Runtime.freeMemory();
    System.out.println("Processing Time: " + (endTime - startTime)/100 + " milli secs.");
    System.out.println("Memory Use: " + (endMem - startMem)/1024 + " KB.");
    }
This loop is actually spread over two different classes in the code. You can find the
corresponding source code in files PMethod.java and
XPBmain.java under package org.xperf.xpb. The importatn thing to
note is that all the runs are within same execution of the JVM ( so that the warmup overhead
is incurred only once ) and each run consists of a number of processing iterations ( so that
the measurement window is large enough to get meaningful average processing time ). Each
processing iteration processes all the specified input files.
Following precautions were taken while running the measurement program:
- No other activity was happening on the machine.
- Multiple execution runs were observed to ensure consistency of measurement figures.
- Out of 4 runs, the average of best 2 results were taken for comparison. This ensured that the
startup overhead of class loading and comiler warmup didn't skew the results.
- Mesurement tests were repeated with loopcount of 1000 for smaller data sizes to ensure that
the error due to small processing time didn't invalidate the measurements. In most cases, the
results were found to be similar to those with loopcount of 100.
Some measurements were also taken under different conditions. These are mentioned under
conclusions.
XML data to be used as input data was obtained from Google using
Googles' Web API by issuing SOAP requests
with search string "Bill Gates". Files
res0.xml,
res1.xml, ...,
res9.xml, a total of ten, were created
by saving the returned documents, each having 10 search result entries, res0.xml containing first
to ninth, res1.xml
containing tenth to nineteenth and so on. Each file is a valid SOAP document and is approximately
10KB in size. A big file having all the entries, file
res.xml was
created by concatenating the entries of all the other files. Note that file res.xml is
not a textual concatenation of the files but contains the totality of the search result entries,
thus preserving the
structure of a valid SOAP document but with a total size that is slightly less than the sum of
individual file sizes.
Three input data sets are made from these files:
| Input Data Set | Files | Total Size |
| DS1 | res0.xml | 11.9 KB |
| DS2 | res.xml | 98.3 KB |
| DS3 | res0.xml, ..., res9.xml | 111.7 KB |
The rationale behind choosing these files as input data is that these are good examples of
real life XML content. If your files are very different in size or structure or both, run the
measurement program on your data set to get an idea of the parsing performance.
Note: I collected these files sometime in the middle of May 2002. Due to dynamic nature of the
Web, if you try the same query now, you may not get exactly same search results.
Random XML data can also be generated by the supplied rxgen utility.
This program takes a number or approximate size in KB as an argument and generates a somewhat
random XML document. Look at the source file org.xperf.xpb.RandXMLGen.java
( included in the distribution ) to understand how the random file is generated.
Random files generated by rxgen utility are used for some of the measurement
tests involving large XML files.
Purpose of these measurements is to gain insight into following questions:
- How do different parser implementations for a specific API, say SAX or DOM or XmlPull or XSLT,
compare for a given processing -- in processing time? in memory utilization?
- How does the choice of JVM impact the performance?
- How does the CPU speed impact the performance?
- Do the parser implementations scale with filesize?
- When is choice of right API really important?
- How is parser performance improving over time?
I have deferred certain questions for a future exercise:
- How does Java XML processing performance compare with those in other environments such as C,
C++ or even C#?
- What is the performance overhead of validation -- DTD based? XML schema based?
- What is the impact of input documents with different XML contents for each iteration?
- What is the impact of concurrent processing in different threads on a multi-CPU machine?
- What are typical XML processing operations being used in real life applications? How do
different processors compare for these processing operations?
The following tables captures the measurements for data sets DS1,
DS2, and DS3 and under different measurement conditions. Recall
that the machine running the measurement tests has an AMD Athlon 900MHz CPU and 512 MB of SDRAM and
is running Windows 2000. Measurements are of average processing time (in milli seconds)
per operation, the operation being computation of XStat values on the specified data file(s) as
described under Measurement Process section.
| Software Environment |
Input Data Set |
Avg. Time
for DS1 |
Avg. Time
for DS2 |
Avg. Time
for DS3 |
| Processing API |
j2sdk1.4 from Sun,
xerces-1.4.4,
xalan-2.3.1,
xpp3,
JDOM-Beta8,
dom4j-1.3 |
SAX | 9 | 37 | 95 |
| DOM | 22 | 140 | 231 |
| PULL | 6 | 22 | 60 |
| JDOM | 20 | 120 | 201 |
| XSLT | 90 | 206 | 856 |
| DOM4J | 22 | 137 | 212 |
|
j2sdk1.4 from Sun
( includes JAXP impl.),
kxml,
JDOM-Beta8,
dom4j-1.3 |
SAX | 5 | 26 | 55 |
| DOM | 9 | 81 | 90 |
| PULL | 6 | 35 | 68 |
| JDOM | 10 | 99 | 113 |
| XSLT | 56 | 177 | 578 |
| DOM4J | 11 | 118 | 115 |
|
j2sdk1.3.1_02 from Sun
xerces-1.4.4,
xalan-2.3.1,
xpp3,
JDOM-Beta8,
dom4j-1.3 |
SAX | 7 | 36 | 80 |
| DOM | 19 | 108 | 193 |
| PULL | 6 | 23 | 60 |
| JDOM | 18 | 115 | 183 |
| XSLT | 64 | 310 | 619 |
| DOM4J | 19 | 127 | 185 |
|
jrockit 1.3.1 from BEA
xerces-1.4.4,
xalan-2.3.1,
xpp3,
JDOM-Beta8,
dom4j-1.3 |
SAX | 6 | 31 | 63 |
| DOM | 11 | 75 | 102 |
| PULL | 4 | 17 | 44 |
| JDOM | 21 | 151 | 186 |
| XSLT | 37 | 193 | 344 |
| DOM4J | 12 | 88 | 110 |
|
ibmjdk 1.3 from IBM
xerces-1.4.4,
xalan-2.3.1,
xpp3,
JDOM-Beta8,
dom4j-1.3 |
SAX | 6 | 29 | 59 |
| DOM | 10 | 61 | 97 |
| PULL | 3 | 14 | 38 |
| JDOM | 12 | 73 | 119 |
| XSLT | 46 | 283 | 445 |
| DOM4J | 13 | 86 | 126 |
|
j2sdk1.4.0 from Sun
Piccolo 1.02
|
SAX | 6 | 23 | 67 |
|
j2sdk1.4 from Sun,
GNU JAXP Beta1, |
SAX | 8 | 38 | 81 |
| DOM | 19 | 146 | 189 |
| XSLT | 61 | 199 | 627 |
| DOM4J | 13 | 92 | 126 |
|
j2sdk1.4 from Sun,
xerces 2.0.1, |
SAX | 8 | 30 | 82 |
| DOM | 24 | 104 | 218 |
Next section analyses these results.
Careful analysis of the measurement figures under Mesurements
and with
few additional experimentation, a number of inferences can be made.
Note: The following conclusions are valid only for XStat processing
under the specified Mesurement Environment.
Care must be taken to apply these results to other situations.
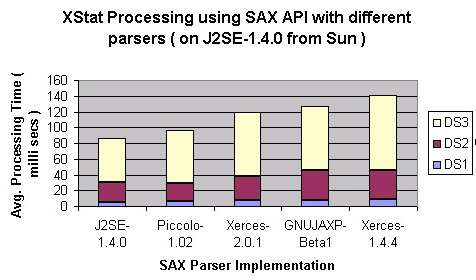
- Comparison among SAX Parsers: SAX Parser bundled with Sun's J2SE SDK-1.4.0 is fastest
and the Xerces-1.4.4 is slowest for XStat Processing of chosen data set among
all the parsers that were tested.
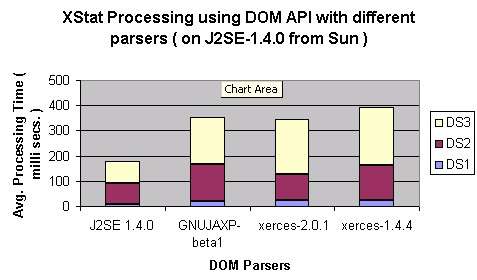
- Comparison among DOM Parsers: DOM Parser bundled with Sun's J2SE SDK-1.4.0 is fastest and
the Xerces-1.4.4 is slowest for XStat Processing of chosen data set among
all the DOM parsers that were tested. An interesting observation is that GNU JAXP processor performed
better than Xerces-2.0.1 on input set DS3 but not on input set DS2. Recall that DS2 consists of a
single large file whereas DS3 consists of ten smaller files.
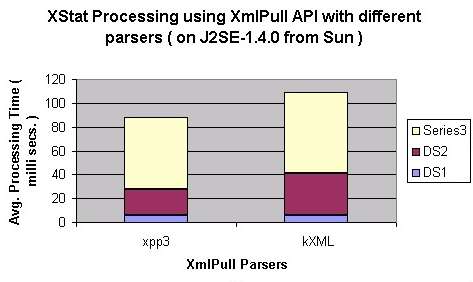
- Comparison among XmlPull Parsers: XPP3 beats kXML in this category ( I had downloaded
both of these in the middle of May 2002 but forgot to write down the exact version of kXML ).
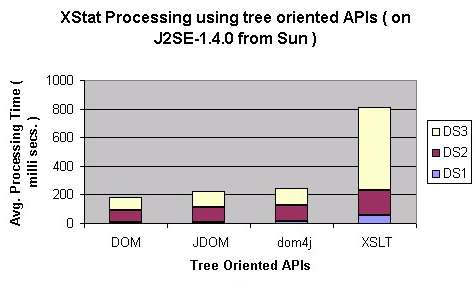
- Comparison among Memory Tree oriented Parsers: Various memory tree orinted APIs
( DOM, JDOM, XSLT and dom4j ) exihibit similar performace
characteristics. However, XSLT based processing is rather slow. This is particularly true for data
set DS3.
This set of observations is for
DOM Parser and XSLT Processor of J2SE 1.4.0 from Sun.
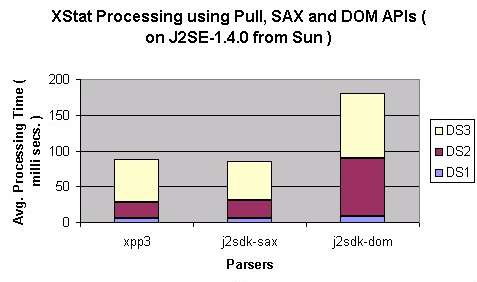
- Comparison across best of XmlPull, SAX and DOM Parsers: Pull and SAX APIs exihibit
similar performance characteristics whereas DOM, not surprisingly, is significantly slower.
This is observed with
parsers best in their class ( XPP3 for XmlPull and J2SDK parser for SAX and DOM ).
This doesn't mean that DOM processing is to be avoided all the time. There are situations
where DOM processing is desirable -- when same or different processing is to be done on the same
content and the processing parameters are not known at the parse time or when the document is
small.
SAX and XmlPull API may be interchangeable from performance perspective but
there may be good reasons to choose one over other based on the type of processing.
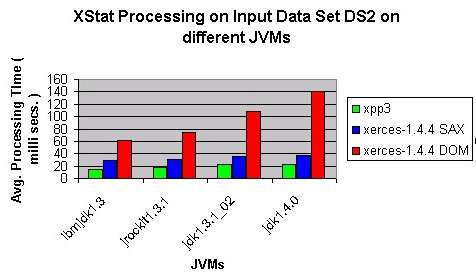
- Comparison across JVMs: The following chart shows processing time for input data DS1
( one xml file of size 98 KB ) using xpp3, xerces-SAX and xerces-DOM under JDK1.3.1 and JDK1.4.0
JVMs from Sun, JRockit1.3.1 JVM and IBM JDK1.3 JVM. IBM's JVM exihibits the best performance. Also,
note that the JVM efficiency has maximum impact on DOM processing. This is so perhaps because DOM
processing involves more memory management operations and the the more efficient JVMs are better
at memory management operations.
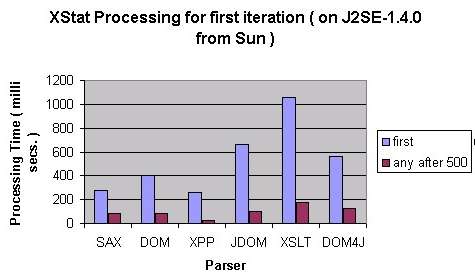
- JVM warmup time: All the previous figures are for steady state processing where the
JVM has the same operations many times before the measurements are taken. It is okay to compare
steady state processing time for server applications
that process large no. of documents within single run. But it doesn't give an idea of performance
when the JVM is started to process a single document. The following chart compares the processing time
for first iteration with that of any iteration after 500 iterations for processing using different
APIs on input data DS2 ( one XML file of size 98 KB ).
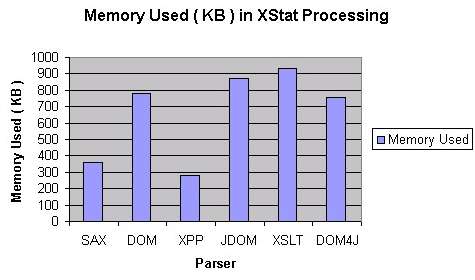
- Memory Requirement: Processing time is only one measure of efficiency, another being the
amount of memory used for processing. The following chart compares the amount of memory used by
different APIs on input data DS2 ( one XML file of size 98 KB ). These measurements were taken
with loopcount set to 1 and runcount set to 10. This is done by invoking the command
"
ant run -Dxpb.loopcount=1 -Dxpb.runcount=10". Note that there is a forced garbage
collection at the end of each run, outside the timing measurement window. ( Note: forced garbage
collection seems to work for J2SE1.4.0 but not for all JVMs ).
Consideration of memory usage is very important in multi-threaded server applications where multiple
threads might be processing different documents at the same time. If total memory requirement of
all such processing exceeds the available RAM then the whole application will become very
slow due to excessive swapping.
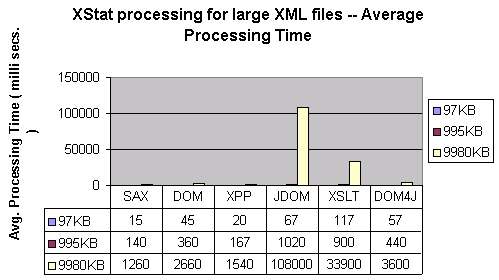
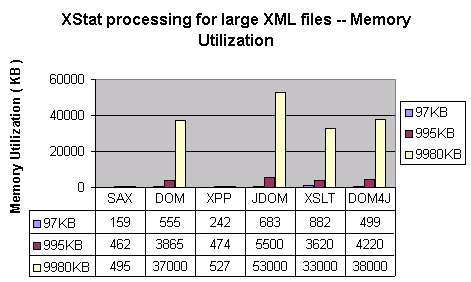
- Large XML files: It is interesting to see how processing time and memory use changes
with increasing file size. The following charts show exactly this. XStat Processing was applied on
three files of size 97KB, 995KB and 9980KB. These files were generated by utility
rxgen by invoking the command "rxgen -datasize 100",
"rxgen -datasize 1000", and "rxgen -datasize 10000"
respectively.
Note that this command writes the generated content in file data\rxgen.xml.
The following chart shows the average processing time. Most remarkable is the non-linear
increase in processing time for JDOM. At first sight, it appears to be a measurement error but
I was not able to fix it and have a strong suspicion that there is a problem in JDOM beta8 code.
The next chart shows the amount of memory used.
It is remarkable that small differences in processing time and memory use become very pronounced
at large data sizes. Also, not all APIs and implementations scale gracefully. JDOM Beta8 is certainly
one example.